4 common Regression Techniques in Machine Learning you need to check out!
Linear and Logistic regressions are usually the first algorithms people learn in data science. Due to their popularity, a lot of analysts even end up thinking that they are the only form of regressions. The ones who are slightly more involved think that they are the most important among all forms of regression analysis.
The truth is that there are innumerable forms of regressions, which can be performed. Each form has its importance and a specific condition where they are best suited to apply. In this article, I have explained the most commonly used 4 types of regression in Machine Learning in a simple manner. Through this article, I also hope that people develop an idea of the breadth of regressions, instead of just applying linear/logistic regression to every problem they come across and hoping that they would just fit!
1. Linear Regression
It is one of the most widely known modeling techniques and the most famous regression technique in Machine Learning. Linear regression is usually among the first few topics which people pick while learning predictive modeling. In this technique, the dependent variable is continuous, the independent variable(s) can be continuous or discrete, and the nature of the regression line is linear.
Linear Regression establishes a relationship between the dependent variable (Y) and one or more independent variables (X) using a best fit straight line (also known as Regression line).
It is represented by an equation Y=a+b*X + e, where a is the intercept, b is the slope of the line and e is error term. This equation can be used to predict the value of the target variable based on the given predictor variable(s).
The difference between simple linear regression and multiple linear regression, multiple linear regression has (>1) independent variables, whereas simple linear regression has only 1 independent variable. Now, the question is "How do we obtain best-fit line?".
How to obtain the best fit line (Value of a and b)?
This task can be easily accomplished by Least Square Method. It is the most common method used for fitting a regression line. It calculates the best-fit line for the observed data by minimizing the sum of the squares of the vertical deviations from each data point to the line. Because the deviations are first squared, when added, there is no canceling out between positive and negative values.
We can evaluate the model performance using the metric R-square.
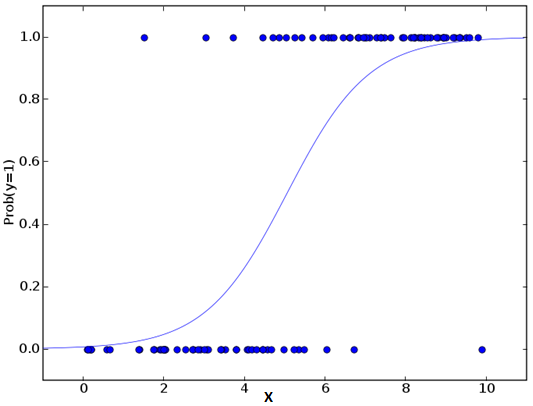
2. Logistic Regression
Logistic regression in Machine Learning is used to find the probability of event=Success and event=Failure. We should use logistic regression when the dependent variable is binary (0/ 1, True/ False, Yes/ No) in nature. Here the value of Y ranges from 0 to 1 and it can be represented by the following equation.
odds= p/ (1-p) = probability of event occurrence / probability of not event occurrence
ln(odds) = ln(p/(1-p))
logit(p) = ln(p/(1-p)) = b0+b1X1+b2X2+b3X3....+bkXk
Above, p is the probability of the presence of the characteristic of interest. A question that you should ask here is "why have we used to log in the equation?".
Since we are working here with a binomial distribution (dependent variable), we need to choose a link function which is best suited for this distribution. And, it is a logit function. In the equation above, the parameters are chosen to maximize the likelihood of observing the sample values rather than minimizing the sum of squared errors (like in ordinary regression).
Important Points:
- It is widely used for classification problems
- Logistic regression doesn’t require a linear relationship between dependent and independent variables. It can handle various types of relationships because it applies a non-linear log transformation to the predicted odds ratio
- To avoid over fitting and under fitting, we should include all significant variables. A good approach to ensure this practice is to use a stepwise method to estimate the logistic regression.
- It requires large sample sizes because maximum likelihood estimates are less powerful at low sample sizes than ordinary least square.
- The independent variables should not be correlated with each other i.e. no multicollinearity. However, we have the option to include interaction effects of categorical variables in the analysis and the model.
- If the values of the dependent variable are ordinal, then it is called as Ordinal logistic regression.
- If the dependent variable is multi-class then it is known as Multinomial Logistic regression.
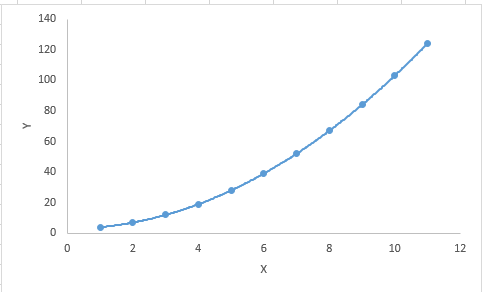
3. Polynomial Regression
A regression equation in Machine Learning is a polynomial regression equation if the power of the independent variable is more than 1. The equation below represents a polynomial equation:
y=a+b*x^2
In this regression technique, the best fit line is not a straight line. It is rather a curve that fits into the data points.
Important Points:
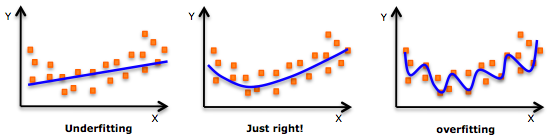
- While there might be a temptation to fit a higher degree polynomial to get a lower error, this can result in over-fitting. Always plot the relationships to see the fit and focus on making sure that the curve fits the nature of the problem. Here is an example of how plotting can help:
- Especially look out for curve towards the ends and see whether those shapes and trends make sense. Higher polynomials can end up producing weird results on extrapolation.
4. Stepwise Regression
This form of regression is used when we deal with multiple independent variables. In this regression technique in Machine Learning, the selection of independent variables is done with the help of an automatic process, which involves no human intervention.
This feat is achieved by observing statistical values like R-square, t-stats and AIC metric to discern significant variables. Stepwise regression fits the regression model by adding/dropping covariates one at a time based on a specified criterion. Some of the most commonly used Stepwise regression methods are listed below:
- Standard stepwise regression does two things. It adds and removes predictors as needed for each step.
- Forward selection starts with the most significant predictor in the model and adds variable for each step.
- Backward elimination starts with all predictors in the model and removes the least significant variable for each step.
This modeling technique aims to maximize the prediction power with a minimum number of predictor variables. It is one of the methods to handle higher dimensionality of data set.